Explanation
Global superstore sales dashboard:
Global superstore dataset collect in the kaggle and load in the excel then remove unwanted columns using power query editor and Using pivot tables for quick Analysis
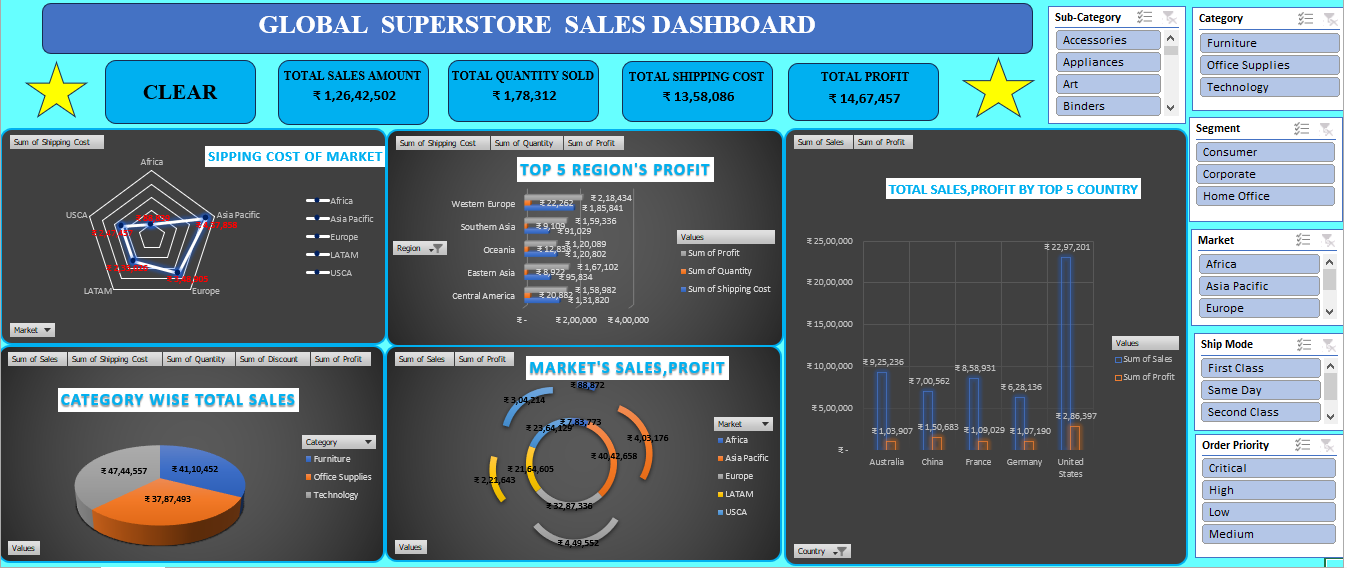
Asia pacific had highest shipping cost of it's market place in the nest chart.
The western europe achive high profit ~$2 lakhs above .
In the column chart United states at top sales.
In the pie chart technology high sales.
In the donat chart asia pacific had dominate of it's sales and profit.
Result
In the top the total sales amount as 126 millions
Total quantity sold 1.7 lakhs
Total shipping cost 1.3millions
Total profit as 1.4 millions
Using differnt filters for easy understand ,quick comparision ,data-driven decision making.
Conclusion
The Global Superstore dataset provides sales performance across different regions and product categories. By analyzing the data, make informed decisions, and optimize our business strategies for better profitability and customer satisfaction.